Pie Chart Questions and Answers
Candidates can find the direct download links for the Data Interpretation Pie Chart Questions and Answers in this section. Aspirants who appearing for the competitive can find the study material below. The Pie Chart Questions model paper given is only for reference purpose.
Pie Chart Questions Papers are helpful for the applicants in the preparation. The Free download links of Pie Chart Questions and Answers Practice Papers enclosed below. Candidates who are going to start their exam preparation can download the Pie Chart Questions and Answers.
Check the Pie Chart Syllabus details in our page. Also, download the Pie Chart Model Question Paper Pdf link in the section following. Data Interpretation Pie Chart Previous Papers are available in our page. We advise the applicants who are in search of Pie Chart Questions Paper to refer the syllabus details.
What is Pie Chart?
Pie chart is the circular presentation of data. Here data whole is broken in some parts. These share part of in the pie diagram is proportionate to its share of the whole data.
There are two approaches to construct a pie chart
1. Percentage Approach: Here each segment in a pie chart is calculated as a part of 100%
2. Degree Approach: Here whole circle is 360⁰ and each part of pie chart is a proportion of 360⁰.
Importance of Pie Chart
1. By Pie Chart we can divide the whole data from any sector in different segments.
2. Comparisons between two data are easier in Pie Chart.
Important Formula
1. Calculation of the angle of a sector of a Pie Chart
Angle\quad of\quad a\quad sector\quad =\quad \frac { Value\quad of\quad the\quad sector }{ Total\quad value } \times 360°2. If Pie Chart is Specialised in Degree then,
Value\quad of\quad any\quad sector\quad =\quad \frac { Angle\quad of\quad the\quad sector }{ 360° } \times Total\quad value3. If Pie Chart is Specialised in Percent then,
Value\quad of\quad any\quad sector\quad =\quad \frac { Angle\quad of\quad the\quad sector }{ 100 } \times Total\quad valueModel Question Papers
Directions (1-5): Answer the questions on the basic of the pie chart given below.

The company has a capital of 200000 equity share of Rs 10 each. The dividend is declared as a percentage of the equity share capital.
1. In the year 2010 the total turnover of the company increased by 11.2% as compared to the year 2019, if the selling and the distribution expenses had a percentage share of 14% in 2019, then how much will it be in rupees?
A. Rs 40.24 crores
B. Rs 44.06 crores
C. 4406.2 million
D. Rs 4.406 croes
2. If the company declares 30% dividend for its shareholders, then the total dividend is what percent of the interest paid by the company?
A. 1.43%
B. 1.79%
C. 1.58%
D. 1.29%
3. What would the earning per share for the company?
A. Rs 29750
B. Rs 2975
C. Rs 297.54
D. None of these
4. If Gross Profit = Turnover – Manufacturing Expenses and Operating Profit = Gross Profit – [Administrative Expenses + Selling and distributive Expenses, then what is the ratio of the Operating Profit to the Net Profit?
A. 2.35:1
B. 1.75:1
C. 2.14:1
D. 1:2.49
5. If the Operating Profit in 2019 is Rs 110 crores, the turnover in 2019 is Rs 310 crores and the operating Leverage = Percentage increase in Operating Profit / Percentage increase in turnover, then calculate the operating leverage for the year 2000.
A. 2.11
B. 2.34
C. 3.74
D. 2.67
Directions (6-10): The pie-charts show estimated revenue and expenditure budgets for 2019-2020 for a country.

Notes:-
1. Borrowing and other liabilities increased by Rs.4350 crore in the budget estimates for 2019-2020 over the estimates for 2018-2019.
2. Income Tax brings in Rs.13500 crore according to the budget for 2019-2020.
3. Total expenditure on Defence increased by a whopping 26% (approximate) from Rs.5880 crore in 2018-2019 to Rs.7410 crore in 2019-2020.
6. The approximate difference between the expenditure for Subsidies and Defence, and the revenue generated by Excise, Non-debt receipts and non-tax revenue according to the budget for 2019-2020 is (in Rs.crore):
A. 40000
B. 50000
C. 30000
D. 60000
7. What is the percentage increase in the revenue generated by Borrowings and other liabilities in 2019-2020 over 2018-2019 according to the budgets?
A. 11.5%
B. 17%
C. 5%
D. Cannot be determined
8. If the percentage distribution for the sectors from the expenditure chart remains the same for 2018-2019 and 2019-2020 budgets, then what is the difference in the budgeted expenditures in 2018-2019 and 2019-2020?
A. Rs.11769 crore
B. Rs.16627 crore
C. Rs.79127 crore
D. Cannot be determined
9. According to the budget for 2019-2020, the revenue generated by Service Tax is approximately what per cent of the expenditure on Central plan in the same year?
A. 35%
B. 74%
C. 218%
D. 134%
10. If the percentage distribution for the sectors from the revenue and the expenditure chart remain the same for 2018-2019 and 2019-2020 budgets, then the revenue generated by Custom duty is what per cent of the expenditure on Interest in the budget for 2018-2019?
A. 101%
B. 125.5%
C. 111%
D. 136%
Sample Question Papers on Data Interpretation
Directions (11-15): Study the following information to answer the given questions. .
Percentage of students in various courses (A, B, C, D, E, F) and Percentage of girls out of these.
Total students: 1200 (800 girls + 400 boys)
 11. For course D what is the respective ratio of boys and girls?
A. 3 : 4
B. 4 : 5
C. 3 : 5
D. 5 : 6
E. None of these
12. For which pair of courses is the number of boys the same?
A. E & F
B. A & D
C. C & F
D. B & D
E. None of these
13. For course E, the number of girls is how much per cent more than the boys for course E?
A. 250
B. 350
C. 150
D. 80
E. None of these
14. For which course is the number of boys the minimum?
A. E
B. F
C. C
D. A
E. None of these
15. How many girls are in course C?
A. 44
B. 16
C. 40
D. 160
E. None of these
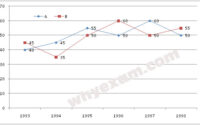
Directions (16-20): Study the following graph carefully and answer the questions given below :
Percentage of different types of employees in a company in two consecutive years

16. In 2005 the total no. of which of the following types of pairs of employees was approximately equal to A type of employees in 2006?
A. B and C
B. A and C
C. D and E
D. C and D
E. C and F
17. From 2005 to 2006 in the case of which of the following types of employees the change was maximum?
A. B
B. D
C. C
D. A
E. None of these
18. What was the approximate different in the number of B type of employees during 2005 and 2006?
A. 2285
B. 2325
C. 2085
D. 2620
E. 1825
19. If the no. D type of employees in 2006 was 5000, what would have been its approximate percentage in the company?
A. 8
B. 12
C. 14
D. 16
E. 10
20. The no. of A type of employees in 2006 was approximately what per cent of the no. of A type of employees in 2005?
A. 115
B. 140
C. 125
D. 130
E. 95